About the community
Motivation
We decided that if we were going to work with a community, it was important to:
Define the boundaries clearly and get a sense of the total number of individuals and households living within these boundaries. This would in-turn help the planning and logistics of any sub-project by answering questions like: “How many mosquito nets should we procure?”
Understand some socio-demographic characteristics to brainstorm and target the most useful interventions. For example, finding out if the community primarily comprises of young men living alone or of full families would inform a very different set of interventions.
What we did
We designed and conducted a short survey intended to capture basic details about every household living within the defined boundaries. You can see these boundaries on the homepage.
Our local coordinator, Vikram, identified and trained 12 surveyors to go door-to-door and fill out a digital form using SurveyCTO on their smartphones. You can view the form here.
The survey ran from 10th to 18th July, 2020 and covered 1495 households. Results from this data are presented below.
Before proceeding, it’s worth flagging a few caveats and challenges faced during this exercise:
Coverage: While the survey was conducted after the nationwide Covid-19 lockdown was lifted, several migrant households in the community that had travelled to their native villages had not returned. Our local coordinator believes there are approximately 200 households like this, and it is unclear how many will return in the coming months.
Data quality: The surveyors had no prior digital data collection experience. While the survey was simple, there is a possibility that huts were missed or minor errors crept into data collection, particularly for tricky questions such as identifying who counts as a household member. While surveyors were monitored closely during data collection, conducting back-checks on the data was outside the scope of this activity and so it is tough to quantify the magnitude of such errors. That said, we remain confident that the data is good enough to meet the purposes laid out above.
Household profile
In total, we found 1495 households, totalling 6385 individuals. The map below shows the spatial distribution of households; there appear to be a few clear clusters closer to the Noida Link Road and Mayur Vihar-1, with density decreasing closer to the river bank.
Most households live in huts or shacks, as you will notice in the pictures on the home page.

A large majority of those living here are living as families. The average household size is 4.3 members, with only 108 single-member households.
This point is re-iterated when we observe the age distribution: 46.2% of individuals are under the age of 18!

Education
The data on education attainment paints a troubling picture.

Of those over the age of 21, and thus likely to have completed their education, only 11% have passed 10th standard. A majority have not even finished primary education.
What is arguably more concerning, is that this cycle of under-attainment seems to persist with children currently of schoolgoing age. Based on age alone, the light blue bars in the graph below show the number of children expected to have completed each grade level. It is cumulative, in the sense that a child aged 18 is expected to have completed 1st - 12th grade. The dark blue bars show the number of children that have actually completed these levels according to our survey.

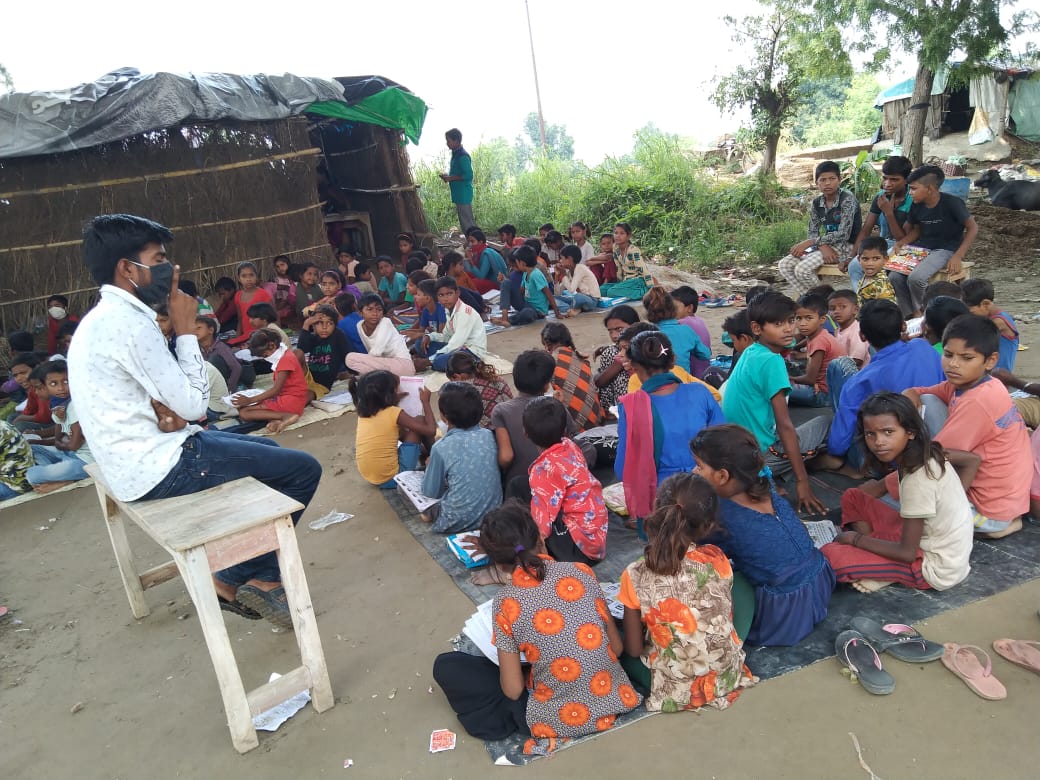
While we may expect to see a gap in senior secondary levels (10-12), the gaps in primary and secondary education of a magnitude around 300 children is surprising. This is backed up by anecdotal evidence on the ground: children in the community may have dropped out to work in the fields or due to lack of interest, and despite now being old enough for a higher grade, do not have the numeracy or literacy skills to re-enroll at those levels. There is a clear need for remedial education to bring these kids back up to speed and re-enroll them in schools. Below is a picture of one such informal effort in the community. The demand and need for similar efforts is heightened due to the Covid-19 lockdown and related school closures.
What factors drive these dropouts and the resulting shortfalls in education attainment? The regressions below try and dig deeper into this question. It won’t be possible to say anything causal given the limited fields we collected (due to omitted variable bias), but it is an interesting descriptive exercise.
Below are models with two dependent variables. First, a binary variable on whether a child meets the level of education we expect given their age (1 = yes, 0 = no). Second, a variable subtracting expected education level from actual education level to capture the extent of shortfall. The dependent variables are constructed this way because:
Regressing education level directly would not account for the varying ages of the children. Both these measures benchmark education levels to what we expect given their ages.
For both measures, we interpret positive coefficients as being associated with good outcomes; an increase in the likelihood of meeting the expected level, or an increase in actual - expected education (i.e. less shortfall)
Regressions predicting education attainment of children aged 7-18
| Whether child is at expected level (binary) | Difference between actual and expected level | ||
| OLS | probit | OLS | |
| Child is male | 0.055* | 0.143* | 0.532*** |
| (0.028) | (0.073) | (0.181) | |
| Distance to school | -0.074*** | -0.190*** | -0.342*** |
| (0.020) | (0.051) | (0.127) | |
| Average education level of adults in the HH | 0.019*** | 0.050*** | 0.179*** |
| (0.005) | (0.014) | (0.033) | |
| Number of HH members | 0.003 | 0.008 | 0.065 |
| (0.009) | (0.024) | (0.060) | |
| Duration of stay in community | 0.029** | 0.076** | 0.320*** |
| (0.015) | (0.037) | (0.093) | |
| HH has mosquito net | -0.086 | -0.214 | -0.597 |
| (0.117) | (0.306) | (0.749) | |
| HH has working light | -0.239** | -0.641** | -1.782*** |
| (0.099) | (0.265) | (0.632) | |
| HH has toilet | 0.076 | 0.212 | -0.446 |
| (0.116) | (0.311) | (0.744) | |
| Constant | 0.405*** | -0.251 | -3.427*** |
| (0.110) | (0.282) | (0.700) | |
| Observations | 1,239 | 1,239 | 1,239 |
| R2 | 0.036 | 0.053 | |
| F Statistic (df = 8; 1230) | 5.662*** | 8.570*** | |
| Note: | p<0.1; p<0.05; p<0.01 | ||
As expected, the explanatory power of these models are low (R-squared = 3-5%) given the limited variables collected. A summary of the key findings from the variables we do have are as follows:
Greater distance from the child’s household to the nearest school has a significant negative association Distance was calculated as the Euclidean distance (straight line) from the lat-long of the household to the lat-long of the nearest school, so is likely to be lower than the actual travel path but is a decent proxy. This measure ranges from 0.6km to 3.4km, so it is plausible that children to the right tail of this distribution might be reluctant to walk these distances.
Higher average education level of adults in the household has a significant positive association This persistence across generations/older-to-younger siblings makes intuitive sense, even if the exact channels are unclear.
While male and female children are both similarly likely to not match up to the expected education level, males are still 0.5 school years closer than females on average
Children that have been living in the same community for a longer period of time have better outcomes. This also makes intuitive sense; migrant households that move frequently may find it difficult to enroll and keep their children in these schools.
Factors like household size or access to mosquito nets have no significant association
Forthcoming analysis
- Access to services and basic government schemes (phone, bank accounts, ration card, Aadhaar card, voter ID)